A waveform visualization feature is an interesting way to showcase audio in an application.
There are multiple ways to go around it, and we will explore a couple of them by building the feature using Stimulus, the Canvas API with JavaScript classed and Ruby to perform the waveform generation on the server.
This article is complementary to the one where we built an audio player with Stimulus, feel free to check it out if you are also looking to build an audio player.
Let's start by exploring the result of this article:
What we will build
For this application, we will generate waveform visualizations using a couple of approaches to show the different ways to tackle the problem.
We will use the Canvas API to draw the waveform by actually drawing a limited amount of the samples in a <canvas/> element.
The first and most simple approach will be to generate a convincingly looking waveform that doesn't actually represent the track. This is nice because it can improve the perceived experience for users that are not too focused on how the actual audio looks like.
The second approach will be to generate the graph from waveform data which actually represents the audio using Ruby and offsetting that part to a background job to make the process seamless.
The final result should look like this:
Application setup
We will start by creating a new Rails application:
$ rails new waves --css=tailwind
Next, we will add Avo to easily create new resources with audio uploads. Let's start by installing it:
bundle add avo && bundle install
Now let's install Avo to generate the avo.rb initializer and mount it to the route file:
bin/rails generate avo:install
Then, we will create a Episode model which we will use to later showcase how to generate the waveform data in a background job when creating a track:
bin/rails generate model Episode name data:text duration:integer
Because we've installed Avo, the previous command will add an Episode resource to our admin panel.
Then, we install the ActiveStorage migrations:
bin/rails generate active_storage:install
Then, we migrate our database:
bin/rails db:migrate
We add the proper configuration to our model:
# app/models/episode.rb
class Episode < ApplicationRecord
  has_one_attached :audio

  validates :name, presence: true
end
Now, we make sure that our Avo resource is correctly configured:
class Avo::Resources::Episode < Avo::BaseResource
  def fields
    field :id, as: :id
    field :name, as: :text
    field :duration, as: :number, hide_on: [:new, :edit]
    field :audio, as: :file
  end
end
Next, if we navigate to /avo/resources/episodes we should see an empty list for the episodes:
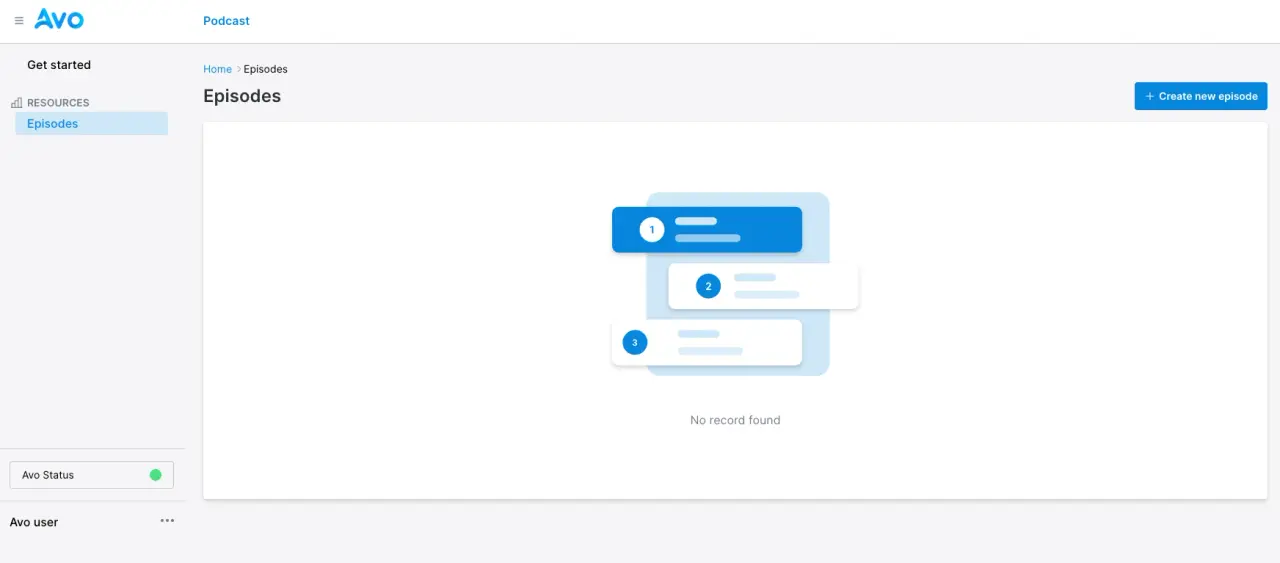
We can create episodes with audio uploads using Avo and Active Storage. Check our article on S3 uploads with Active Storage if you want to upload files to the cloud.
With the installation out of the way, let's learn a bit about digital audio before jumping into the actual waveform generation process.
Of course, skip to the actual generation of waveforms if you already know about the subject.
A bit about digital audio
As a physical phenomenon, sound is the propagation of vibration as an acoustic wave through a medium like air, water, or even solids like walls or metal.
Generally, when we think of sound, we think of the movement of air that's picked up by our ears and interpreted as such in our brains.
Audio, on the other hand, is the electrical representation of sound, which can be analog or digital. While sound is the actual movement of air particles, audio is recorded sound that is stored in different types of media which can be used to reproduce the sound anytime.
An analog representation of audio results in an alternating current that is analog to the original sound, hence the name.
A digital representation of audio results in a set of samples which are are then used to recreate the original waveform and because they are mostly a set of numbers, they can be easily stored, understood and manipulated with computers.
Let's dig a bit into sampling first:
Sampling
In digital audio, sampling is the act of capturing instantaneous sound amplitudes at a given interval of time.
The interval we choose is called the sample frequency: if it's big enough, the original analog signal can be re-created without significant losses.
The following visualization, which shows an original analog signal consisting of a sine wave first, the number of samples taken and finally the reconstructed signal, might help you understand how it works:
As we decrease the sample rate, we get a lower resolution re-constructed signal, and the contrary happens as we increase the sample rate.
But, what does this have to do with generating a waveform? Well, we will be extracting information about samples in our audio file to produce a set of points that we will use to draw the waveform.
Waveform generation
The first thing we need to learn is how to draw a waveform in the browser.
One approach could be to place a <div> with a certain height and spacing for each sample we want to represent in our waveform, but this approach puts unnecessary weight on the DOM and is not suitable if we need to make dynamic visualizations.
Instead, we will use the Canvas API to produce the desired results. Let's start by learning to draw a set of lines in a rectangle:
Drawing bars with Canvas
The first step is to define the <canvas> element in the document:
<div class="max-w-screen-lg mx-auto px-6 py-16" id="container">
  <div class="w-full h-48">
    <canvas id="canvas" class="w-full h-full"></canvas>
  </div>
</div>
This element allows us to draw shapes, paths, text, etc. within itself programmatically. To start working with it, we just need to access the canvas element which has #canvas ID and then access its 2D context which we will actually use to draw:
const container = document.getElementById("container")
const canvas = document.getElementById("canvas")
const ctx = canvas.getContext("2d")
Then, let's define the canvas width, height:
const {height, width} = container.getBoundingClientRect()
canvas.height = height
canvas.width = width
Next, let's add a fill color using the Canvas context we stored in the ctx variable:
ctx.fillStyle = '#f1f5f9';
ctx.fillRect(0, 0, width, height);
This should produce the following result:
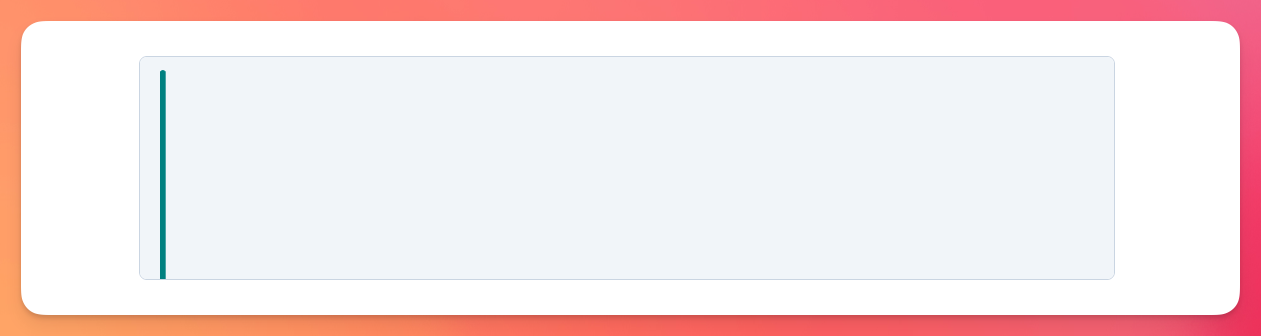
Let's now draw one line that starts at the bottom of the canvas and goes all the way to the top, minus a margin:
const padding = 24

ctx.beginPath()
ctx.moveTo(padding, height)
ctx.lineWidth = 6;
ctx.lineCap = "round";
ctx.strokeStyle = "teal";
ctx.lineTo(padding, padding)
ctx.stroke()
ctx.closePath()
Which produces the following result:
Yes, it's not the most exciting result, but we're getting closer. Let's draw a set of lines that go until the end of the canvas, with some spacing between them.
We need to do basically the same we already did, but within a loop:
const barCount = 75
const spacing = 6
const barWidth = 8
const padding = 24

ctx.lineWidth = barWidth;
ctx.lineCap = "round";
ctx.strokeStyle = "teal";

for (let i = 0; i < barCount; i++) {
  const barHeight = Math.random() * (height - padding);
  const startX = (i * (spacing + barWidth));
  const topY = height - padding - barHeight;

  ctx.beginPath();
  ctx.moveTo(startX, height);
  ctx.lineTo(startX, topY);
  ctx.stroke();
}
Here, we're predefining the number of bars we want to draw, a fixed spacing between them and a padding which we're using to avoid the bars reaching the top of the canvas.
Then, inside the loop, that's executed 75 times, we set a random number for the barHeight, set the startX point by multiplying the current loop index with the sum of the spacing and the barWidth to make sure the spacing between them is constant and, finally, we're actually drawing each bar just like we did before.
Executing the code results in the following:
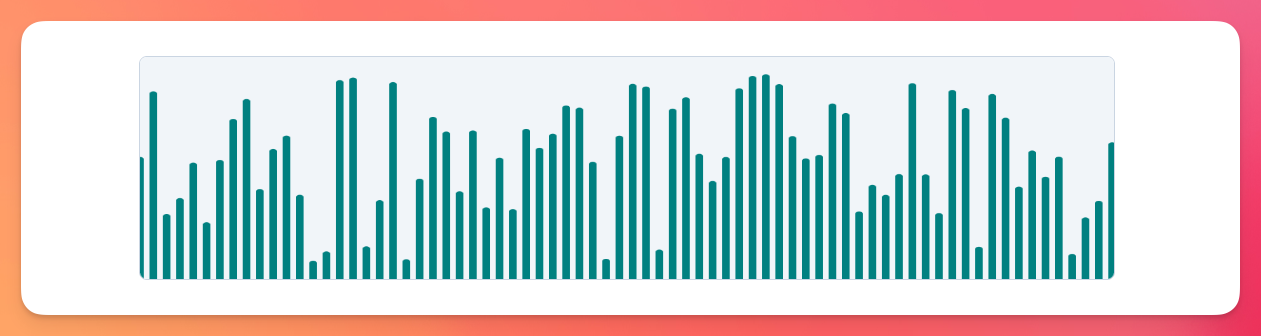
Even though it resembles a waveform, we're not there yet: the random barHeight introduces some weird improbable jumps between high and low amplitudes, so let's correct that and add a couple of features to improve the looks of our waveform.
Improving the results
Now, let's fix some of the things that make our graph not as realistic as it can be.
The first improvement is to calculate the amount of space so we can fit the exact number of bars that are set in the barCount variable.
The second change is to generate the waveforms in a separate loop and store them in the amplitudes array.
Firstly, let's smooth the changes by introducing three variables: isPeak, a boolean that is true around 5% of the time, change which is a negative or positive number added to the previous amplitude stored in prevAmplitude value.
Lastly, we make sure that the amplitude is within the 0.05 inferior and 0.9 superior limits, this means that our bars will never go over the height of the canvas:
const barCount = 120
const barWidth = 4
const padding = 8
const centerY = height / 2
const availableWidth = width - (padding * 2)
const barSpacing = availableWidth / (barCount - 1) // There are (n - 1) spaces in an n number of bars.
const amplitudes = Array(barCount).fill(0)
let prevAmplitude = Math.random() * 0.4 // Randomly assign a first amplitude
for (let i = 0; i < barCount; i ++) {
const isPeak = Math.random() < 0.05
const change = isPeak ? Math.random() * 0.3 : (Math.random() - 0.5) * 0.25
prevAmplitude = Math.max(0.05, Math.min(0.9, prevAmplitude + change))
amplitudes[i] = prevAmplitude
}
ctx.lineWidth = barWidth;
ctx.lineCap = "round";
ctx.strokeStyle = "teal";
for (let i = 0; i < barCount; i++) {
const barHeight = amplitudes[i] * (height - padding * 2);
const startX = (i * barSpacing) + padding
const endY = height - barHeight;
ctx.beginPath();
ctx.moveTo(startX, height);
ctx.lineTo(startX, endY);
ctx.stroke();
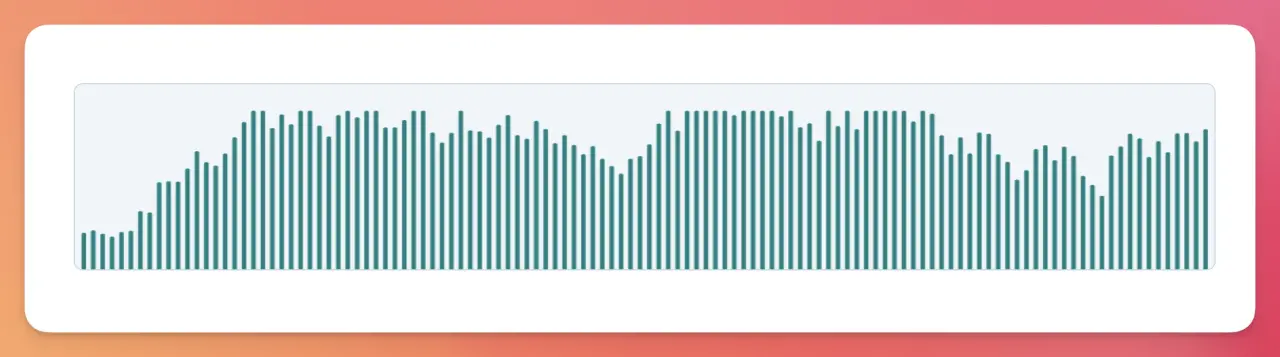
}
This produces the following result:
Let's improve the result by mirroring the graph, which generates the same bar from the y-axis center.
To achieve this, we define the centerY variable which is set to height / 2 we change the moveTo argument for the y-axis, so the line starts at the vertical center minus the barHeight / 2 and we set the finishing point of the line to be set at the vertical center plus the barHeight / 2:
const centerY = height / 2

// Rest of the code
ctx.beginPath();
ctx.moveTo(startX, centerY - (barHeight / 2))
ctx.lineTo(startX, centerY + (barHeight / 2))
ctx.stroke();
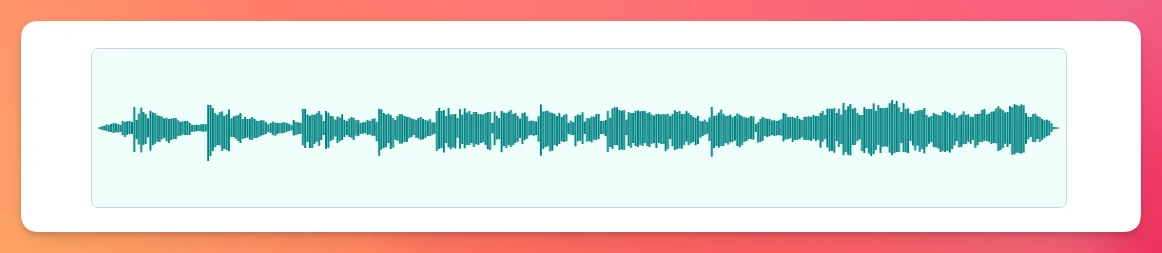
This produces the following result:
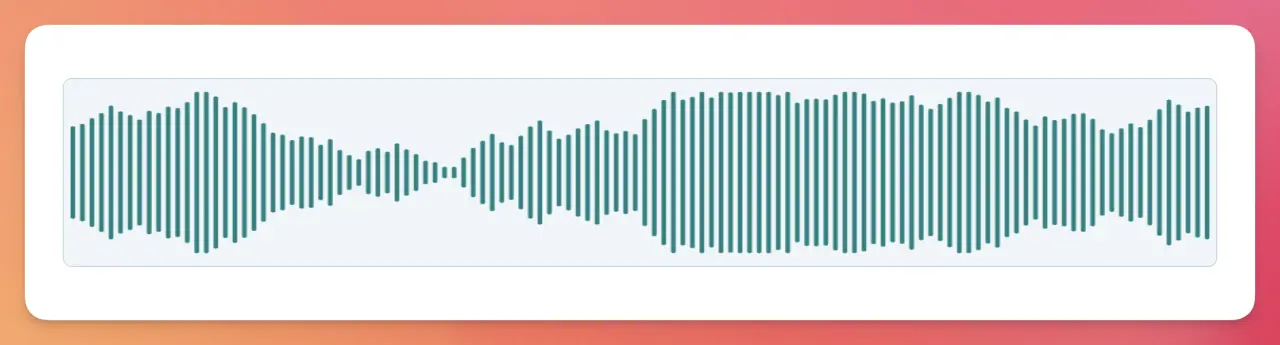
Currently, we have something that's usable for an audio related project.
But, we can improve this by actually picking the amplitudes from actual audio samples instead of generating them ourselves like we're doing here.
So, let's start by learning how to generate the waveform data using Ruby:
Waveform data using Ruby
To extract waveform data using Ruby we will actually cheat a little by using a CLI that generates the waveform data for us, and we will call it using a Ruby class.
For this, we will use audiowaveform developed by the BBC, which is a C++ program that can generate waveform data and render images from audio files.
It's more convenient than alternatives because it can handle MP3, WAV, FLAC and Ogg Vorbis and Opus files.
Follow their installation guidelines and make sure it works on your operating system.
We will encapsulate the extraction into a WaveformData class, and we will be using the Open3 module which provides us with access to the stdin, stdout and stderr so we can throw an error if the waveform generation fails.
Our class will receive a file, define a generate method that returns the data as a Ruby hash and a to_json method which generates a JSON.
It works by executing the audiowaveform command, storing the result in a Tempfile and returning the output. If the file is an instance of an ActiveStorage::Blob or if it's an ActiveStorage::Attachment it will download the file contents and save them into a @temp_file instance variable which gets cleaned up at the end of the process.
class WaveformData
  attr_reader :file, :pixels_per_second
  attr_accessor :temp_file

  def initialize(file, pixels_per_second = 10)
    @file = file
    @pixels_per_second = pixels_per_second
    @temp_file = nil
  end

  def generate
    Tempfile.create(['waveform', '.json']) do |temp_output|
      stdout, stderr, status = Open3.capture3(*command(temp_output.path))

      unless status.success?
        raise "Failed to generate JSON: #{stderr.strip}"
      end

      temp_output.rewind
      JSON.parse(temp_output.read)
    ensure
      cleanup_temp_file
    end
  end

  def to_json
    JSON.generate(generate)
  end

  private

  def file_path
    if file.respond_to?(:path)
      file.path
    elsif file.respond_to?(:tempfile)
      file.tempfile.path
    elsif (file.respond_to?(:blob) || file.is_a?(ActiveStorage::Blob)) && defined?(ActiveStorage)
      download_blob_to_tempfile(file.respond_to?(:blob) ? file.blob : file)
    else
      raise ArgumentError, "Unsupported file type: #{file.class}"
    end
  end

  def command(temp_output_path)
    ['audiowaveform',
      '-i', file_path,
      '-o', temp_output_path,
      '--pixels-per-second', pixels_per_second.to_s]
  end

  def download_blob_to_tempfile(blob)
    @temp_file = Tempfile.new(['active-storage', File.extname(blob.filename.to_s)])
    @temp_file.binmode
    blob.download { |chunk| @temp_file.write(chunk) }
    @temp_file.flush
    @temp_file.rewind
    @temp_file.path
  end

  def cleanup_temp_file
    @temp_file&.close
    @temp_file&.unlink
    @temp_file = nil
  end
end
Now, to use our WaveformData class, we just need a File instance to pass it to the class and then generate the JSON:
file = File.open(Rails.root.join("audio-file.mp3"))
data = WaveformData.new(file).to_json
This will output a JSON hash which includes the following keys:
-
version: represents the version number of the waveform data format. -
channels: the number of waveform channels present in the data. -
sample_rate: the sample rate for the original sound file. -
samples_per_pixel: the number of samples that go into a pixel when generating an image. This also determines the length of the amplitudes array. -
bits: the resolution of the waveform data. It may be8or16. It represents the number of possible values the amplitude has. For 16 bits, we can have values that go from-32768to+32768. -
length: the number of minimum and maximum value pairs per channel. If we're working with a single channel and with the--pixels-per-secondset to1, this value should match the track's duration. -
data: the array of interleaved minimum and maximum waveform data points.
To access the actual array, we access the data key data["data"] which gives us an array of amplitudes:
# The actual array holds many more elements
[-1911, 1944, -8490, 9999, -7025, 9206, -4108, 5937, -9505, 13513]
Consider that, in our case, the amplitudes represent one channel of the audio and are interleaved, meaning that the pairs represent minimum and maximum values for a given sample.
With this array, we can generate the waveform just like we did before using the Canvas API:
The main difference is that we're not generating the data semi-randomly anymore, we're actually using the data we get from the server in JSON format, normalizing it by dividing every value by 32768 and also including an amplitudeScale which we set to height * 0.5 to make sure the waveform extends up to half of the canvas height above and below the center.
  const availableWidth = width - (padding * 2);
  const totalBars = Math.floor(data.length / 2);
  const barSpacing = totalBars <= 1 ? 0 : availableWidth / (totalBars - 1);
  const amplitudeScale = height * 0.5

  for (let i = 0; i < normalizedData.length; i += 2) {
    if (i + 1 < normalizedData.length) {
      const min = normalizedData[i];
      const max = normalizedData[i + 1];

      const x = padding + (i / 2) * barSpacing;

      ctx.beginPath();
      ctx.moveTo(x, centerY + min * amplitudeScale);
      ctx.lineTo(x, centerY + max * amplitudeScale);
      ctx.stroke();
    }
  }
Now, we will extract the canvas part of the waveform generation into a class to make things easier.
Extracting behavior into a class
Until now, we've been defining behavior by writing isolated JavaScript code that you could run in a <script> tag inside any view.
Let's create a WaveformVisualizer class that receives a <canvas> element and can draw the waveform just like we did before.
The class will receive two arguments: a canvas instance and an options object which will let us configure many things like the data we will use to draw, the backgroundColor for the canvas, the strokeColor for the bars and the progressColor to showcase progress.
We will also let the user customize the barWidth, the padding for the canvas element and, lastly, the amplifyingFactor that we use to adjust the appearance of the waveform:
// app/javascript/waveform_visualizer.js
export default class WaveformVisualizer {
  constructor(canvas, options = {}) {
    this.canvas = canvas;
    this.ctx = this.canvas.getContext('2d');
    this.waveformData = options.waveformData || {data: []};
    this.backgroundColor = options.backgroundColor || "#FFFFFF";
    this.strokeColor = options.strokeColor || "teal";
    this.progressColor = options.progressColor || "#FF5500";
    this.barWidth = options.barWidth || 2;
    this.padding = options.padding || 8;
    this.amplifyingFactor = options.amplifyingFactor || 1;
  }
}
Next, let's define an init method that will be called before actually using the class where we will throw an error if the canvas element is not valid, set the context and the canvas size and initial styles using two “private” methods.
init() {
  if (!this.canvas || !(this.canvas instanceof HTMLCanvasElement)) {
    throw new Error("A valid canvas element is required")
  }

  this.ctx = this.canvas.getContext("2d")

  this._setCanvasSize()
  this._setCanvasStyles()
}

_setCanvasSize() {
  const { width, height } = this.canvas.parentElement.getBoundingClientRect()
  this.canvas.width = width
  this.canvas.height = height
}

_setCanvasStyles() {
  this.ctx.fillStyle = this.backgroundColor
  this.ctx.strokeStyle = this.strokeColor
  this.ctx.lineWidth = this.barWidth
  this.ctx.lineCap = 'round'
  this.ctx.fillRect(0, 0, this.canvas.width, this.canvas.height)
}
Now, let's add a draw method that will do something very similar to what we were doing previously:
draw() {
  const normalizedData = this.waveformData.data.map((v) => v / 32768)
  const amplitudeScale = this.canvas.height * this.amplifyingFactor
  const centerY = this.canvas.height / 2

  const availableWidth = this.canvas.width - (this.padding * 2)
  const totalBars = Math.floor(normalizedData.length / 2)
  const barSpacing = totalBars <= 1 ? 0 : availableWidth / (totalBars - 1)

  for (let i = 0; i < normalizedData.length; i += 2) {
    if (i + 1 < normalizedData.length) {
      const min = normalizedData[i]
      const max = normalizedData[i + 1]
      const x = this.padding + (i / 2) * barSpacing

      this._drawLine(x, centerY + (min * amplitudeScale), centerY + (max * amplitudeScale))
    }
  }
}

_drawLine(x, y1, y2) {
  this.ctx.beginPath();
  this.ctx.moveTo(x, y1);
  this.ctx.lineTo(x, y2);
  this.ctx.stroke();
}
Now, we can use the class to draw waveforms just like before but with a more extensible behavior:
// app/javascript/application.js
import WaveformVisualizer from "./waveform_visualizer"

const canvas = document.querySelectorAll("canvas")
canvas.forEach(canvas => {
  const data = JSON.parse(canvas.dataset.waveform)
  const options = {
    waveformData: data
  }
  const visualizer = new WaveformVisualizer(canvas, options)
  visualizer.init()
  visualizer.draw()
})
Note that we're passing the waveform data through the data-waveform attribute on the canvas element.
We get the following result:
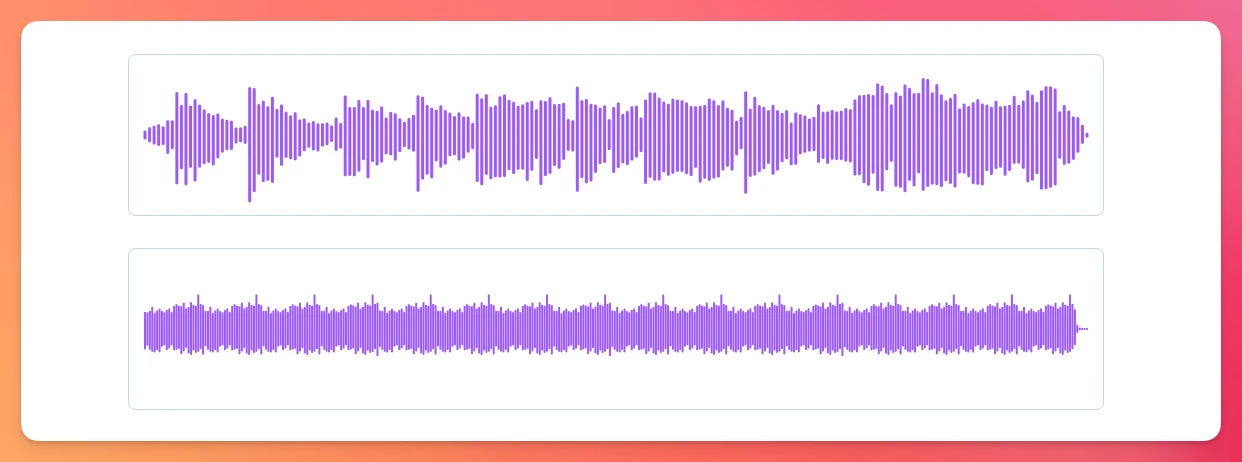
As you can see, we're displaying two different waveforms that we extracted from audio tracks we uploaded to our application.
Stimulus Controller
Now that we've defined the WaveformVisualizer class, let's define a Stimulus controller to better encapsulate the behavior:
import { Controller } form "@hotwired/stimulus"
import WaveformVisualizer from "../waveform_visualizer"

export default class extends Controller {
  static targets = ["canvas"]
  static values = {
    duration: Number,
    waveformData: {type: Object, default: {}},
    backgroundColor: {type: String, default: "#FFFFFF"},
    progressColor: {type: String, default: "#9c59ff"},
    strokeColor: {type: String, default: "#9c59ff"},
    barWidth: {type: Number, default: 2},
    padding: {type: Number, default: 8},
    amplifyingFactor: {type: Number, default: 1}
  }

  connect() {
    if (!this.hasCanvasTarget) throw new Error("Canvas target is required")
    if (!this.hasWaveformDataValue) throw new Error("Waveform data is required.")

    this.visualizer = new WaveformVisualizer(this.canvasTarget, this.visualizerOptions);
    this.visualizer.init();
    this.visualizer.draw();
  }

  get visualizerOptions() {
    return {
      waveformData: this.waveformDataValue,
      backgroundColor: this.backgroundColorValue,
      strokeColor: this.strokeColorValue,
      progressColor: this.progressColorValue,
      barWidth: this.barWidthValue,
      padding: this.paddingValue,
      amplifyingFactor: this.amplifyingFactorValue,
      onSeek: this.seek.bind(this)
    }
  }
}
The controller is a light wrapper over the WaveformVisualizer class, but we can extend it further to achieve behavior like progress animation or seek to playback just like we did in the audio player article but using a waveform instead of a rectangular progress bar.
To facilitate the usage of the controller, we're providing default values for most of the config options and using a visualizerOptions getter to keep them all in the same place.
To use the controller, we just need the following HTML:
<div class="max-w-screen-lg mx-auto px-6 py-16" id="container">
  <div class="space-y-8">
    <% @tracks.each do |track| %>
      <div class="border border-slate-300 rounded-lg w-full px-2">
        <div class="w-full h-40"
        data-controller="waveform"
        data-waveform-waveform-data-value="<%= track.data %>"
        data-waveform-bar-width-value="3"
        data-waveform-progress-color-value="#9c59ff"
        data-waveform-stroke-color-value="#9c59ff"
        data-waveform-amplifying-factor-value="1"
        >
          <canvas id="canvas" data-waveform-target="canvas"></canvas>
        </div>
      </div>
    <% end %>
  </div>
</div>
Beyond the canvas target and the waveformData value, we can rely on the default values and the controller should work.
Usage in Rails
In the setup section, we created an Episode model with name, data and duration attributes. Let's create two background jobs: one to extract the waveform data and another to set the duration attribute by using an ActiveStorage Analyzer.
Let's start with a SetEpisodeDurationJob class:
# app/jobs/set_episode_duration_job.rb
class SetEpisodeDurationJob < ApplicationJob
  queue_as :default

  def perform(episode)
    return if !episode.audio.attached?

    blob = episode.audio.blob
    analyzer = ActiveStorage::Analyzer::AudioAnalyzer.new(blob)
    metadata = analyzer.metadata

    if metadata && metadata[:duration].present?
      episode.update(duration: metadata[:duration].to_i)
    else
      Rails.logger.warn "Couldn't update duration for episode #{episode.name}"
    end
  end
end
Now, let's create a job to extract the waveform using our WaveformData class:
# app/jobs/set_audio_waveform_job.rb
class SetAudioWaveformJob < ApplicationJob
  queue_as :default

  def perform(episode, pixels_per_second = 5)
    waveform = WaveformData.new(episode.audio, pixels_per_second)
    waveform_json = JSON.generate(waveform.generate)
    episode.update(data: waveform_json)
  end
end
Then, we add them as callbacks to our Episode model:
class Episode < ApplicationRecord
  has_one_attached :audio

  validates :name, presence: true

  after_save :set_duration
  after_save :set_audio_waveform

  private

  def set_duration
    SetEpisodeDurationJob.perform_later(self)
  end

  def set_audio_waveform
    SetAudioWaveformJob.perform_later(self)
  end
end
Now, if we create or edit an Episode we will set the duration and the waveform data that we can use to display the waveform as we see fit.
Summary
In this article, we learned how to generate waveform visualizations for audio files using two different approaches: generating semi-random waveforms that look like audio and using the audiowaveform command to generate them using Ruby.
The first step was to learn a bit about digital audio to better understand the process.
Then created the visualizations using the Canvas API, first by making it work with vanilla JavaScript and then by extracting the behavior to a class and encapsulating it with Stimulus.
We also learned how to generate the waveform amplitudes using Ruby and how to integrate it with Rails by adding async workers to perform the waveform generation after an audio upload.
I hope this article, together with the previous one about building an audio player with Stimulus, can help you implement the feature or improve it with your approach.
Don't hesitate to share with us what you built.
Have a good one and happy coding!